
Adult traffic doesn’t perform the same in January as it does in July, or on a Tuesday morning as on a Saturday at midnight. Demand has a rhythm, and once you learn to read it that rhythm is fairly predictable: it climbs on specific dates, sinks on others and shifts with the user’s time zone and hemisphere. This article is about turning that calendar into an edge for your affiliate campaigns.
Why demand rises and falls
Seasonality isn’t magic or industry superstition. It tracks how people actually live. Leisure spending in general —and adult content in particular— depends on free time, mood, the money in someone’s wallet and whether there’s something better to do that night. When those factors line up, traffic and willingness to spend go up. When they don’t, they drop.
For an affiliate, the psychology matters less than the fact that these patterns repeat year after year with enough regularity to plan around them. You don’t need to guess. You need to anticipate.
The cycles that repeat
Daily and weekly cycle
The shortest and most reliable pattern is the day and the week. Nights carry far more volume than mornings, and the weekend —Friday night through Sunday— is usually the strongest stretch: people have time, they’re at home and in less of a hurry. Weeknight late hours perform too, but with lower volume.
For the affiliate, that means two things: check what time you serve your creatives and when you concentrate your bids, and don’t judge a campaign by its Monday-morning numbers.
Monthly cycle
There’s a modest but real bump at the start of the month, when a lot of people get paid. Willingness to spend on subscriptions, tips or impulse purchases is higher with a freshly funded account than on the 27th, when money is tight. If your offer depends on the user paying, the first days of the month tend to convert better.
Yearly cycle
This is the richest one and the one that allows the most planning. Across the year certain dates move mood, the work calendar and spending: Valentine’s Day in February, summer with its holidays, Halloween at the end of October, and the Black Friday–Christmas block that closes the year. Each one shifts what people are looking for and how much they’re willing to spend.
Seasonal calendar by quarter
This is a general map, not a law. Use it as a starting point and adjust it with your own data. Any numbers below are illustrative.
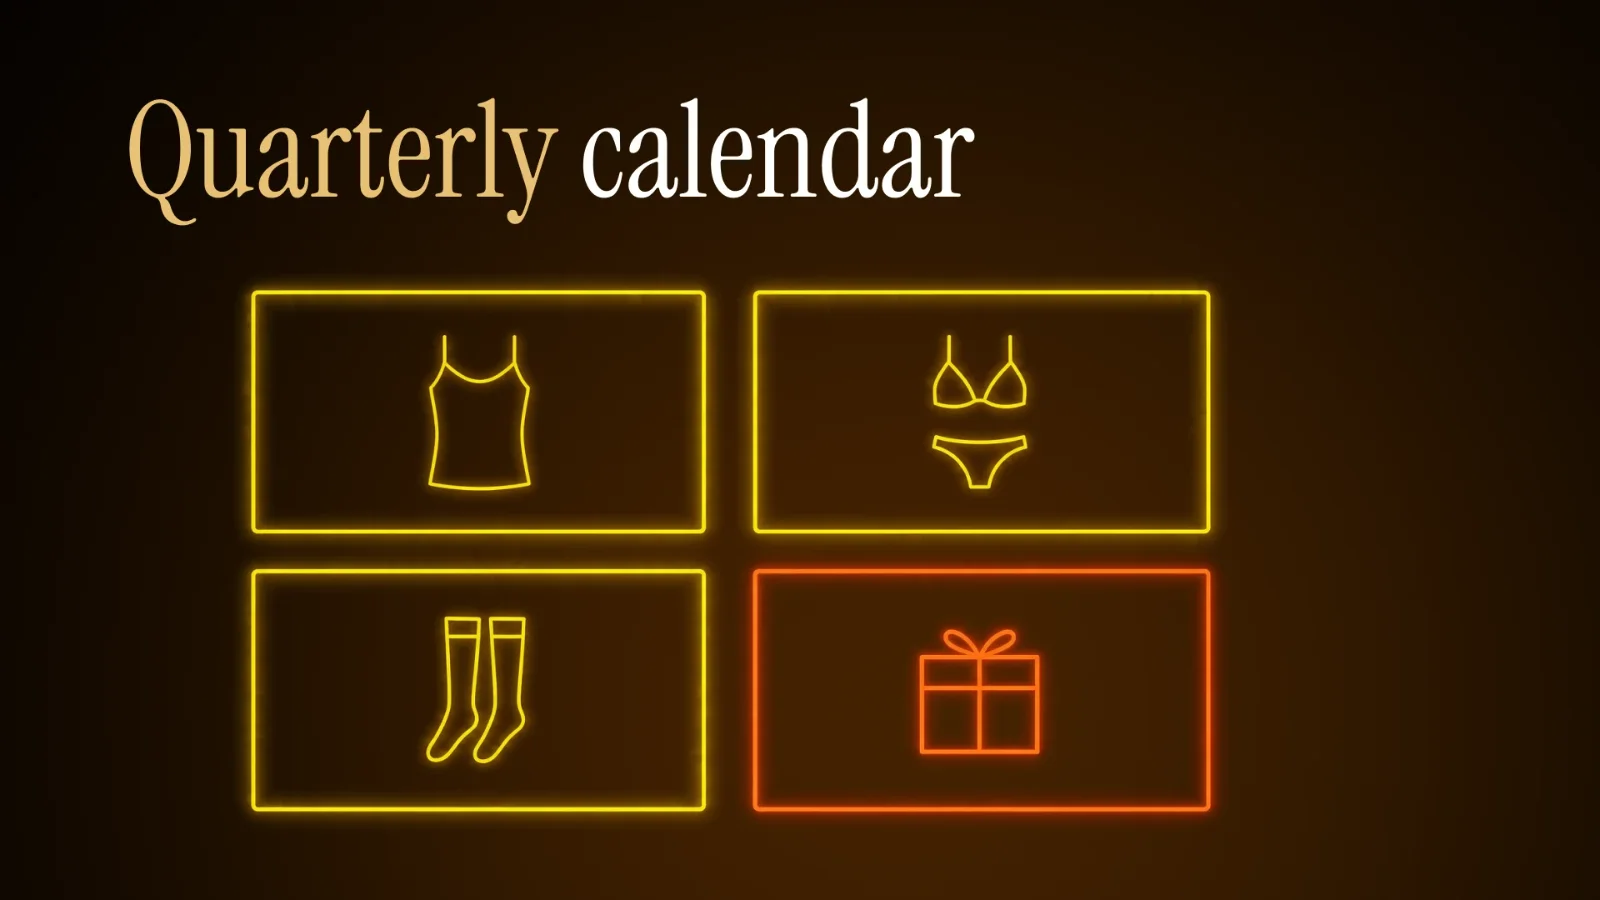
- Q1 (January to March): the year start and Valentine’s Day on 14 February. January lands soft after holiday spending, with a clear lift around Valentine’s. Rebuild pace gradually and have your Valentine’s creatives ready as early as January.
- Q2 (April to June): spring, long weekends and the start of summer in the northern hemisphere. Demand holds steady and starts rising with warm weather and holidays. Test new angles and start splitting geos by hemisphere.
- Q3 (July to September): peak summer in the north, holidays and back-to-routine in September. Summer runs uneven: long nights add, travel subtracts, and September brings the routine back. Do not cut on a soft July, and reinforce at back-to-work.
- Q4 (October to December): Halloween, Black Friday, Christmas and year-end. This is the hottest stretch of the year for attention and spending. Maximum investment, with creatives prepared since September.
How to plan the calendar ahead
The most expensive seasonality mistake is being late. A Valentine’s campaign launched on 13 February has already lost half its window. Work from an annual calendar and count backwards from each date.
- Mark the strong dates of the year on a shared calendar, with their real window: not the exact day, but the seven to ten days before, when search heats up.
- Set a “creatives ready” date ahead of each campaign, with room for revisions and approvals.
- Reserve budget in advance for the big Q4 peaks instead of splitting it evenly across months.
- Leave slack to react: not everything is plannable, and some events come up without warning.
Adapting creatives and offer to each season
The same campaign with the same creative for twelve months straight ages fast. Seasonality gives you natural excuses to refresh the message without inventing anything: the hook is already on the calendar.
- Change the angle, not just the image: at Valentine’s the message is about company; in summer, about free time and long nights.
- Adjust the offer you feature: on high-spend dates it makes sense to push the fuller offer; in soft months, an entry-level hook.
- Reuse what worked last year as a base, but refresh the design so it doesn’t look recycled.
- Have the variants built before the window opens, not halfway through it.
Budget and bids by season
Peaks bring more traffic, but also more competition for it, so costs rise. The move here is to enter the peak prepared and with margin rather than sit it out. An illustrative CPC of $0.20 in the low season can become $0.35 at the height of a Q4 campaign; if your conversion rate rises too, it’s still profitable.
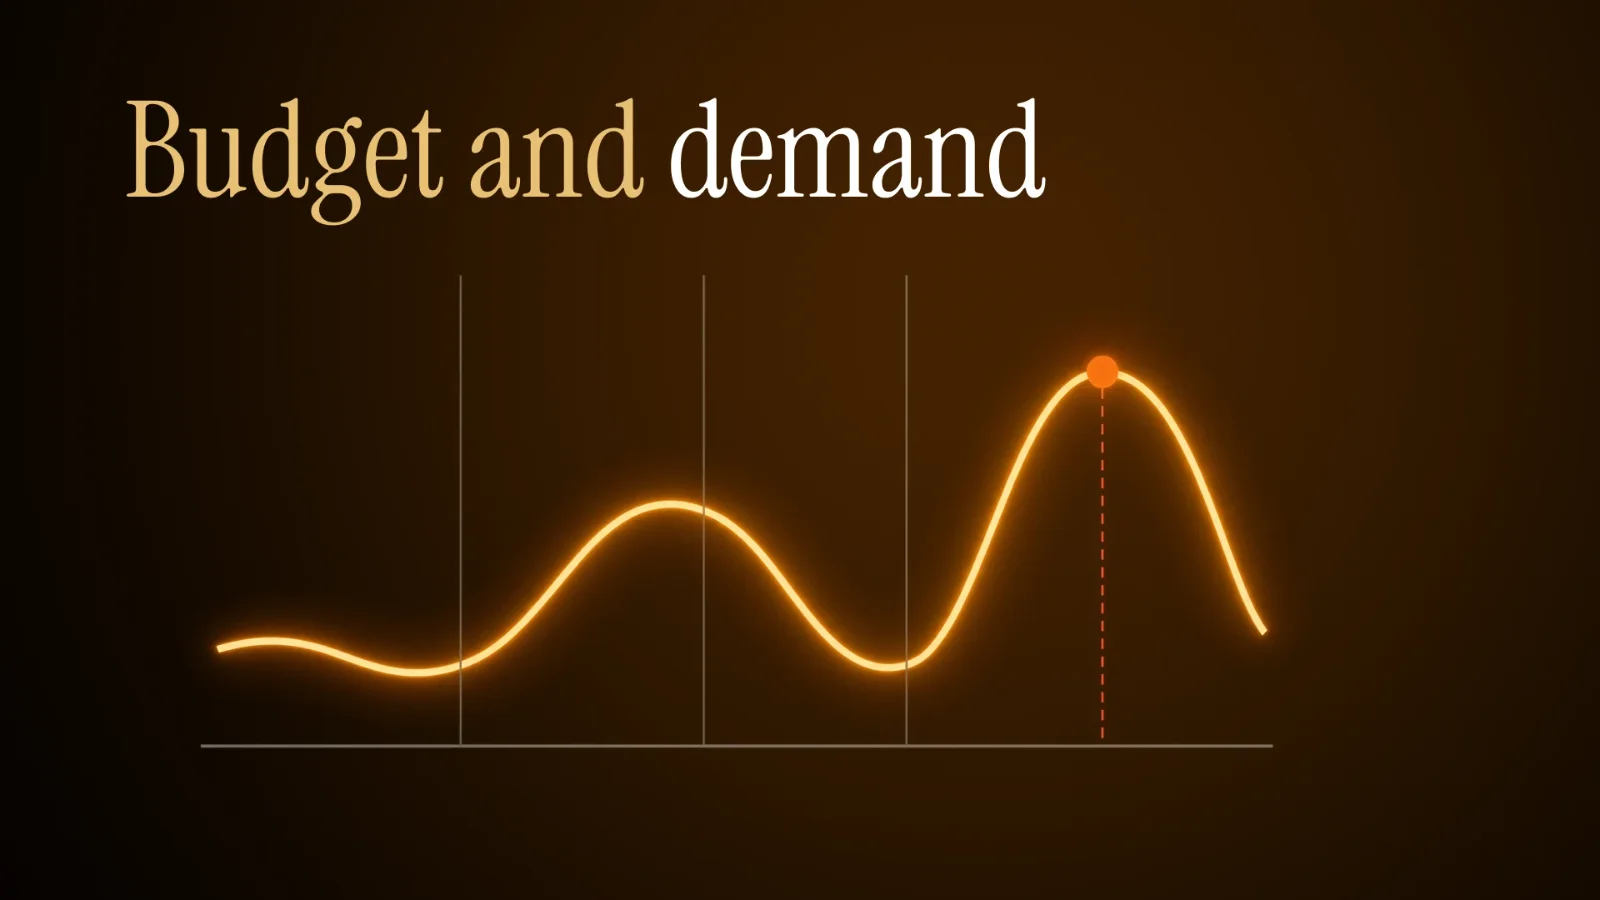
- Raise bids and budget in the strong windows, with a clear cap so spend doesn’t run away.
- In the low season, don’t switch off completely: keep a presence at lower spend so you don’t lose learning or positions.
- Watch return, not just cost: a pricier click that converts better can be the deal of the year.
Geos and hemispheres: summer isn’t the same for everyone
One detail that often slips through: the seasons are flipped between hemispheres. When it’s summer in Spain, much of South America is in winter. If you split by geo, your “summer campaign” can’t launch in the same month for everyone.

- Separate your geos by hemisphere before planning seasonal campaigns.
- Commercial dates aren’t universal either: some are celebrated on different dates or not at all in certain countries.
- Adjust the time bands too: the “night” of your traffic depends on where the user is.
Measuring year over year to anticipate
Seasonality is only an edge if you measure it. Comparing a month with the previous one is misleading, because it mixes the seasonal effect with the real trend. What’s useful is comparing each period with the same period last year: February against February, Black Friday against Black Friday.
- Save each seasonal campaign’s data —its window, its spend and its return— so you have a reference next year.
- Look for the pattern, not the exact figure: you want to know that Valentine’s performs better than a normal February, not to nail the number.
- Use the history to decide when to start warming each campaign and when to cut it.
Common mistakes
- Being late to the date: launching once the peak has already started instead of being in place when it kicks off.
- Not preparing creatives ahead and building them in a rush mid-campaign.
- Cutting a campaign that’s still converting just because the date has passed; many windows have a tail.
- Treating every geo as one market and ignoring hemisphere and local dates.
- Splitting budget evenly across months instead of concentrating it where demand is.
- Comparing consecutive months and panicking over drops that are purely seasonal.
Frequently asked questions
How far ahead do I need to prepare a seasonal campaign?
It depends on the size of the date, but as a rule have your creatives ready one or two weeks before the search window opens, and the budget assigned before that. For the Q4 block it’s worth starting to prepare in September.
Should I switch campaigns off in the low season?
Rarely all the way. Lowering spend makes sense; switching off completely means you lose learning, positions and history. Keeping a minimal presence usually costs less than rebuilding from scratch.
How do I know when to cut a seasonal campaign?
Judge it by return, not the calendar. Many dates have a tail: conversion doesn’t drop to zero the day after. Cut when the numbers stop paying off, not when the diary says so.
Does seasonality affect every payout model equally?
The traffic pattern is similar, but the impact on your income changes with the model. With a recurring revenue-share model, a user captured at a good moment keeps generating afterwards; with pay-per-action models, the peak matters most at the instant of conversion.
The calendar already flags the peaks; what you decide is who you ride them with. At Amateur Cash you can choose between RevShare, PPL and PPS depending on how you build each season. Let’s talk on Telegram @amateurtvcash or at amateur.cash/en.